


| FY2019 | FY2020 | FY2021 | FY2022 | FY2023 | ||
|---|---|---|---|---|---|---|
| Net sales | Million Yen | 155,503 | 144,757 | 162,526 | 174,973 | 159,510 |
| Operating profit | Million Yen | 12,439 | 11,932 | 11,868 | 8,123 | 4,886 |
| Percentage of operating profit to net sales |
% | 8.0 | 8.2 | 7.3 | 4.6 | 3.1 |
| Ordinary profit | Million Yen | 12,704 | 11,999 | 12,771 | 9,918 | 8,186 |
| Percentage of ordinary profit to net sales |
% | 8.2 | 8.3 | 7.9 | 5.7 | 5.1 |
| Profit attributable to owners of parent |
Million Yen | 7,668 | 7,282 | 6,699 | 5,684 | (8,501) |
| Profit attributable to owners of parent of net sales |
% | 4.9 | 5.0 | 4.1 | 3.2 | (5.3) |
| ROE(Return on equity) | % | 6.0 | 5.4 | 4.7 | 3.9 | (6.0) |
| ROA(Return on assets*) | % | 6.8 | 6.4 | 6.5 | 4.9 | 4.0 |
| Basic earnings per share | Yen | 347.87 | 330.34 | 303.76 | 257.57 | (384.99) |
| Overseas sales | Million Yen | 60,179 | 63,567 | 69,903 | 76,378 | 70,802 |
| Percentage of overseas sales to net sales |
% | 38.7 | 43.9 | 43.0 | 43.7 | 44.4 |
| Net assets | Million Yen | 178,873 | 195,723 | 200,194 | 202,182 | 205,818 |
| Current assets | Million Yen | 85,835 | 89,340 | 93,764 | 97,324 | 105,929 |
| Non-current assets | Million Yen | 93,038 | 106,382 | 106,429 | 104,857 | 99,889 |
| Current liabilities | Million Yen | 42,766 | 46,222 | 47,904 | 46,938 | 53,519 |
| Non-Current liabilities | Million Yen | 6,009 | 6,548 | 5,257 | 6,249 | 10,720 |
| Shareholders’ equity | Million Yen | 127,635 | 140,474 | 144,479 | 146,067 | 139,037 |
| Shareholders’ equity ratio | % | 71.4 | 71.8 | 72.2 | 72.2 | 67,6 |
| Net assets per share | Yen | 5,789.9 | 6,371.8 | 6,549.6 | 6,617.1 | 6,295.3 |
| Price earning ratio | Times | 11.37 | 16.95 | 16.59 | 16.58 | (11,07) |
| R&D Costs | Million Yen | 5,322 | 5,384 | 5,650 | 5,691 | 5,222 |
| Percentage of R&D expenses to net sales |
% | 3.4 | 3.7 | 3.5 | 3.3 | 3.3 |
| Investment in plant & equipment | Million Yen | 8,219 | 10,073 | 9,847 | 12,033 | 8,649 |
| Depreciation & Amortization | Million Yen | 9,078 | 9,569 | 9,533 | 10,083 | 10,686 |
| Net cash provided by operating activities |
Million Yen | 17,232 | 22,300 | 11,328 | 10,852 | 19,814 |
| Net cash used in investing activities |
Million Yen | (11,115) | (12,498) | (11,704) | (10,172) | (6,264) |
| Net cash used in financing activities |
Million Yen | (7,084) | (4,146) | (5,979) | (2,336) | (4,006) |
| Cash and cash equivalents at end of the year |
Million Yen | 18,009 | 23,647 | 18,171 | 17,042 | 27,188 |
| Number of employees | 2,060 | 2,096 | 2,106 | 2,089 | 2,042 | |
*ROA(Return on assets) is calculated based on ordinary profit.
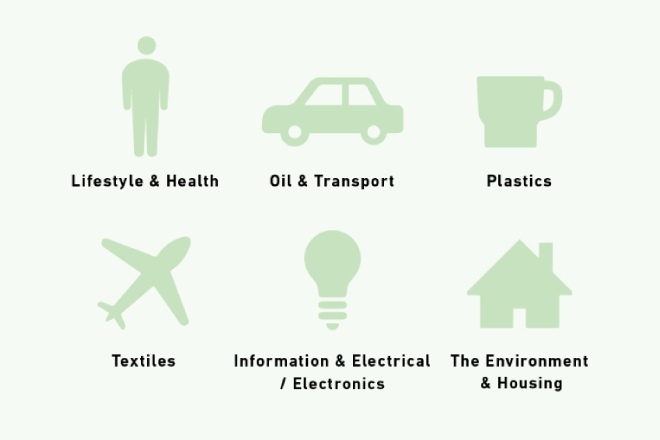
Sales by product group
| FY2019 | FY2020 | FY2021 | FY2022 | FY2023 | ||
|---|---|---|---|---|---|---|
| Toiletries & Health Care | Million Yen | 53,726 | 54,302 | 54,922 | 57,068 | 45,895 |
| Petroleum & Automotives | Million Yen | 42,770 | 37,316 | 42,540 | 48,279 | 50,479 |
| Plastics & Textiles | Million Yen | 21,453 | 20,802 | 25,466 | 28,177 | 25,235 |
| Information & Electrics/Electronics | Million Yen | 20,985 | 17,096 | 20,989 | 23,163 | 22,870 |
| Environmental Protection, Construction & Others |
Million Yen | 16,567 | 15,239 | 18,607 | 18,284 | 15,030 |