MENU
TOP PAGE
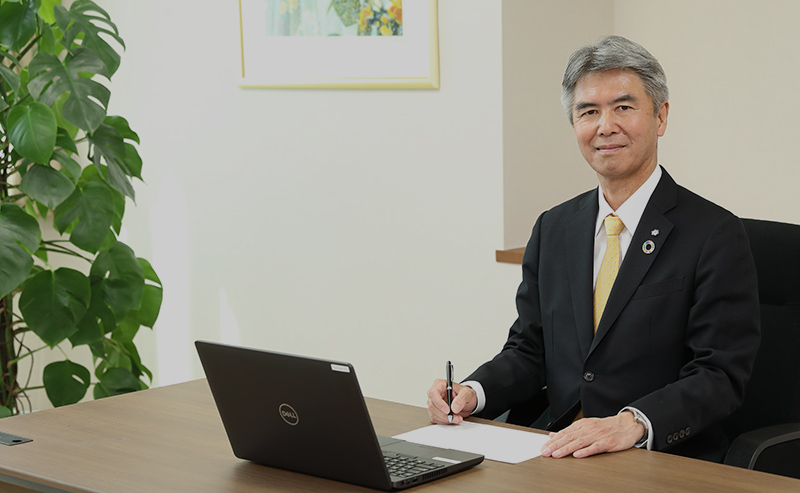
TOP MESSAGE
PRODUCTS SEARCH
Message from the President
Sanyo Chemical GroupMaterial Issues
TOP INTERVIEW
WHO WE ARE
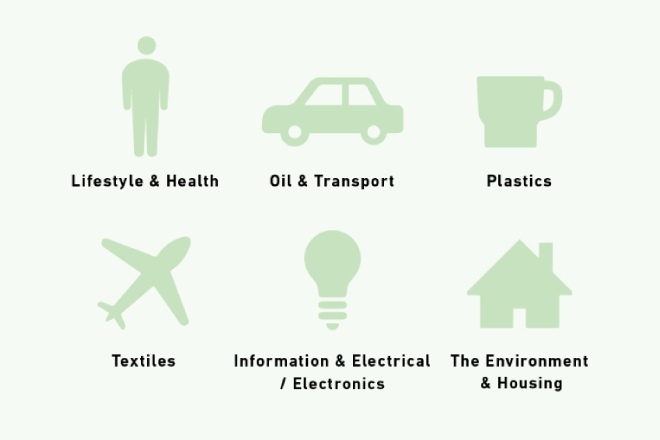
PRODUCTS
SUSTAINABILITY
IR
NEWS
PAGE TOP
▲